Help
sAOP – stressor Adverse Outcome Pathway server
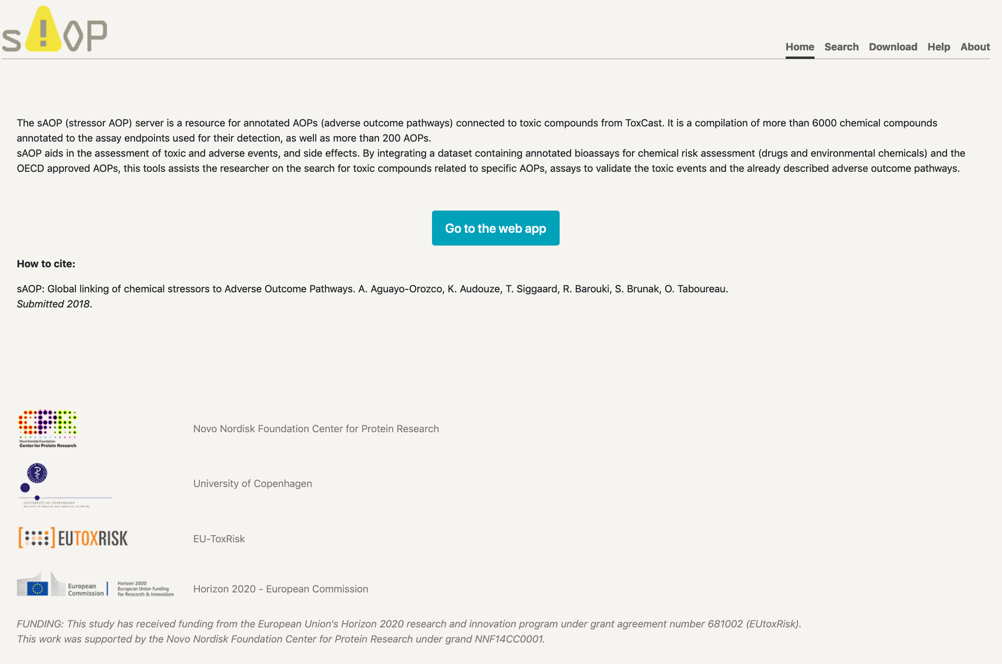
On the initial page, you will find:
- On the right side: Home, Search, Download, Help and About:
- Home: is the initial page showed in the image above.
- Search: is the application, on which you can proceed to find the results of interest (also accessible through “Go to the application” clickable button.)
- Download: where some data can be obtained.
- Help: here you will find the tutorial example for using this web server
- About: information about the creators of this application.
- Description of the web server
- “Go to the application” which re-directs you to the Search engine
- How to cite
- Logos and names of the institutions behind this research server
Search engine
In the connection between ToxCast and AOPs, there exists 4 types of nodes, listed: Chemical, Key Event (molecular initiating event, key event and adverse outcome), Protein and Assay. The connection is made in a longitudinal manner, such that a chemical has been tested in an assay, which corresponds in many cases in a protein effect, thus being connected to a molecular initiating event or key event, and finally leading to a connection with the rest of the Adverse Outcome Pathway. There are 5 types of searches, by AOP, Chemical, Key Event, Protein or Assay.
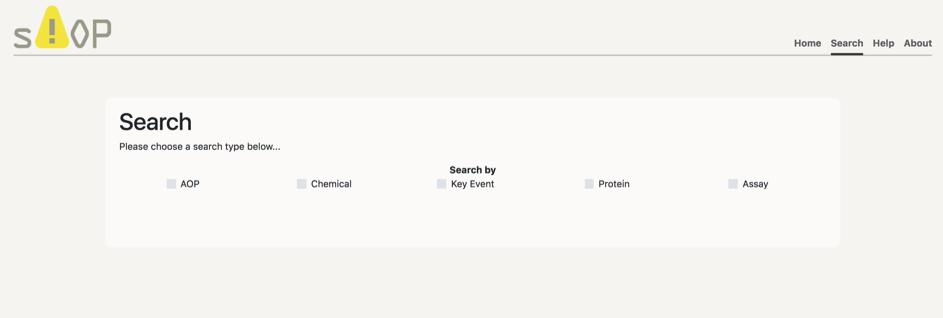
In order to make a search you have to follow the next steps:
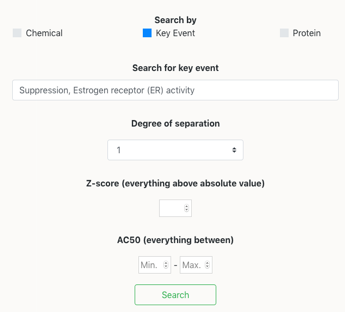
Click on one of the selection button, for instance ‘Chemical’. This will open a box space where you can introduce the name of the chemical you want to search for.
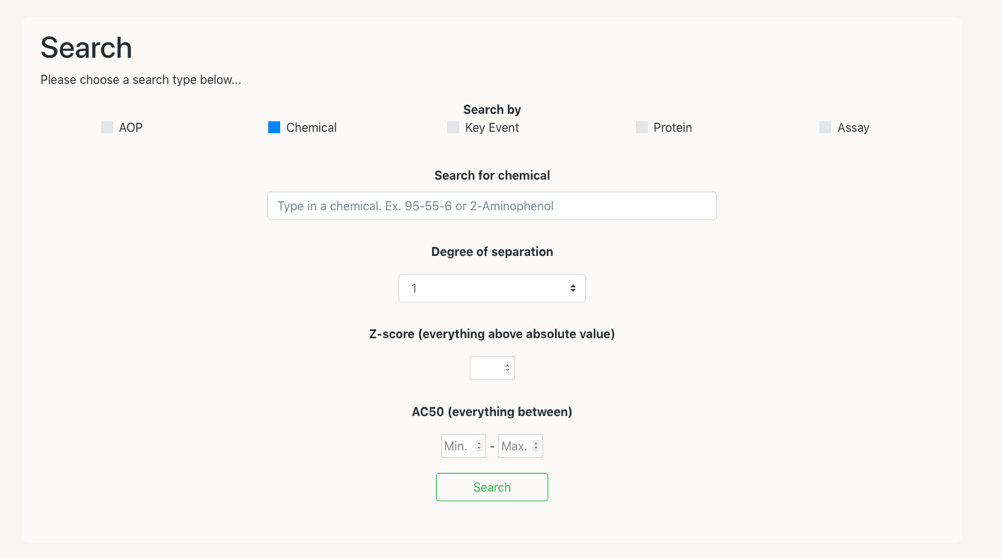
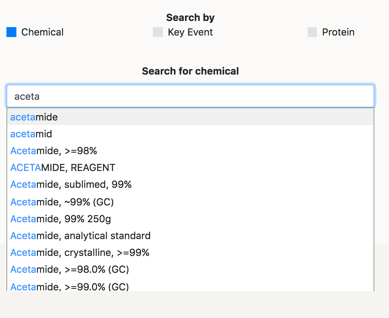
Now you can search for the Chemical you want to mine information for. The search engine accepts any existing synonym and CAS number for the chemicals that are in the database. If you can not remember the full name of the compound, you can type the beginning of it, and the autocomplete function will help you find the full name.
Another option is to select the degree of the network, which will allow for the network to present neighbouring nodes at X degree of distance. So that, if you select degree one –default- only the neighbours at one edge of distance will be presented.
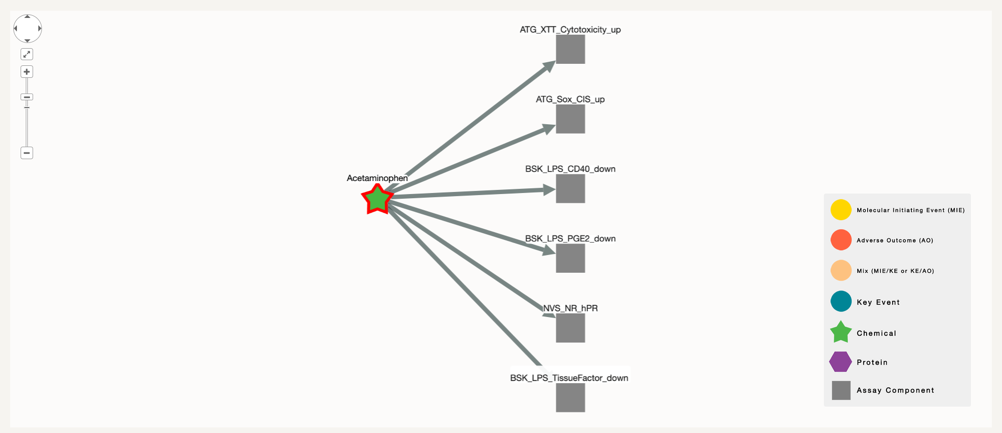
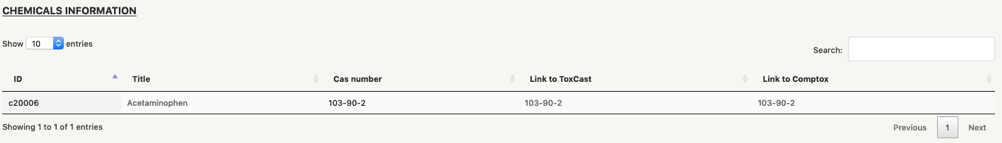
In the case of Acetaminophen, we can see that it has been successfully connected to six assay in ToxCast. This means that this chemical has been tested in these assays.
If we increase the degree up to 2:
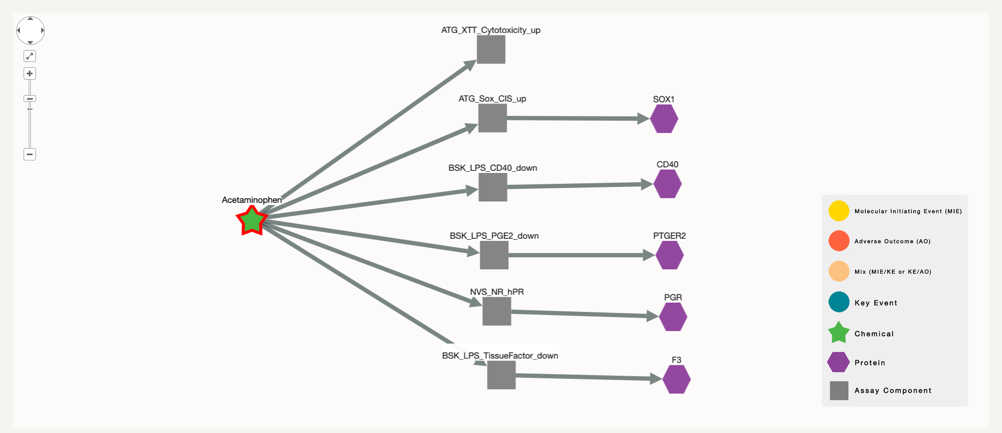
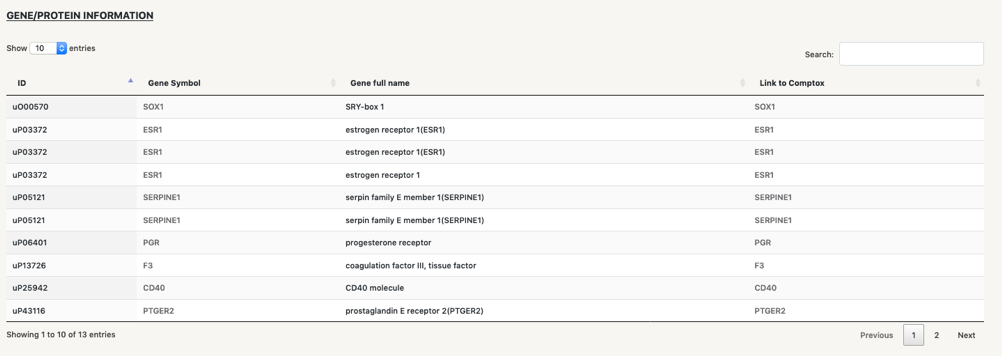
In this step we find the proteins that are associated with the assay in question. In this specific case, five out of the six assays in which Acetaminophen has been tested with successfull results, test for specific biomolecules.
To check for possible effects of this chemical to Adverse Outcomes we ought to increase the degree number. We now select degree 3 or higher to show the nodes in the AOPs, if any, that are connected to the protein, therefore indirectly connected to the selected chemical.
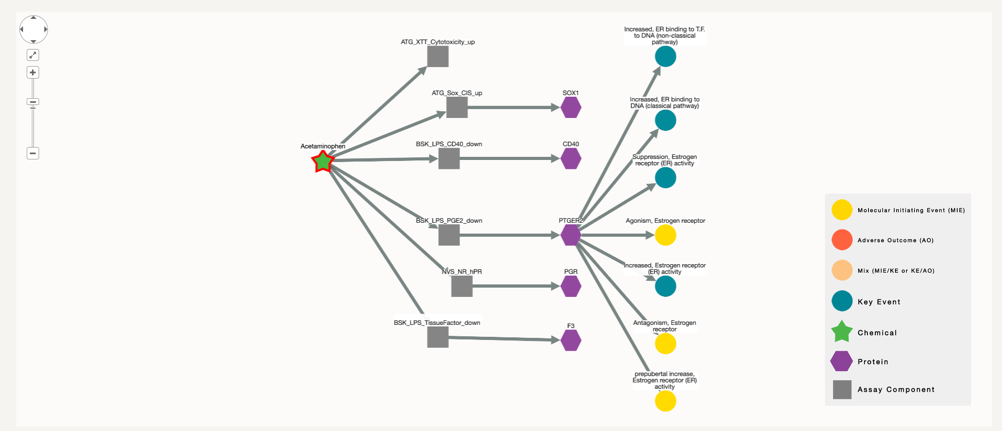
The selection of neighbours is done in both directions, in order to find other potential assays that could be used to test for the proteins that appeared earlier. However, only one of the proteins appear to be part of several key events.
In this case Acetaminophen, connected to protein PTGER2 is also connected to three MIEs and 4 KEs. There is still no Adverse Outcome (AO) linked to the chemical, but if we keep on increasing the degree, at some point it will appear. As it is the case for degree 4.
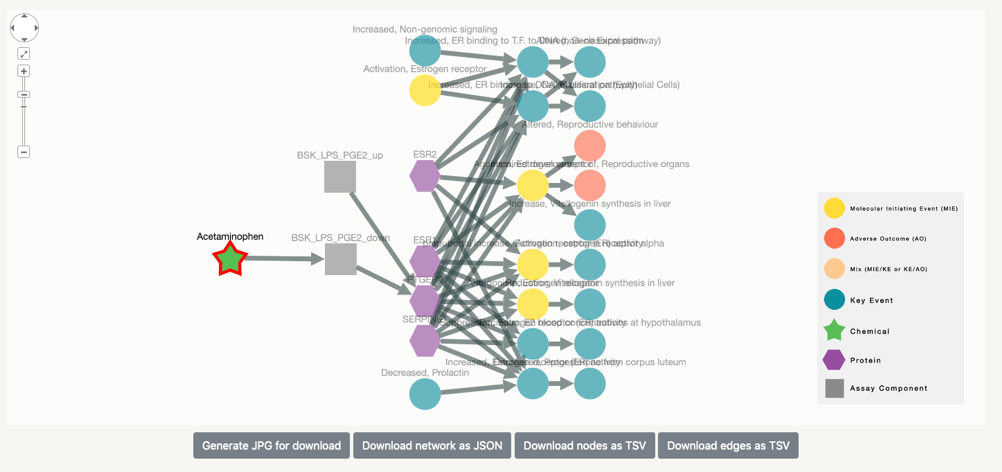
This way the connection between chemical and adverse event through the potentially affected protein and the assay used to test it.
Download information:
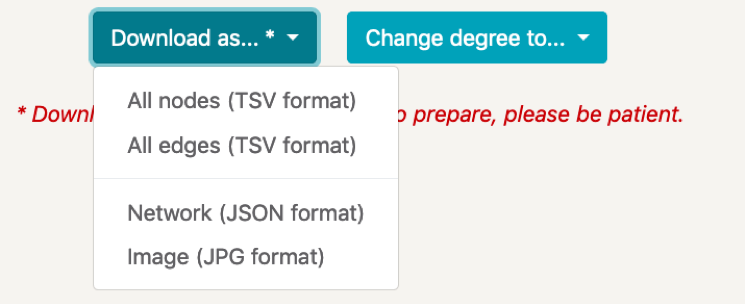
At the bottom of the network application, you have the possibility to download the shown network as a JPG file (click the button twice).
Besides, in order to do further analysis or to create new visualisation, there is a possibility to download the nodes and edges contained in the network as TSV, and the network itself as JSON.
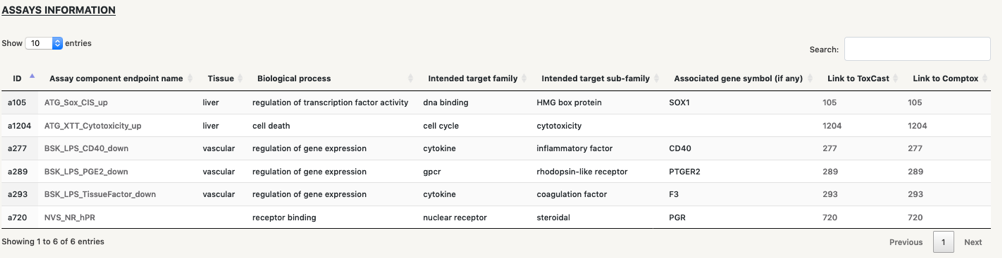
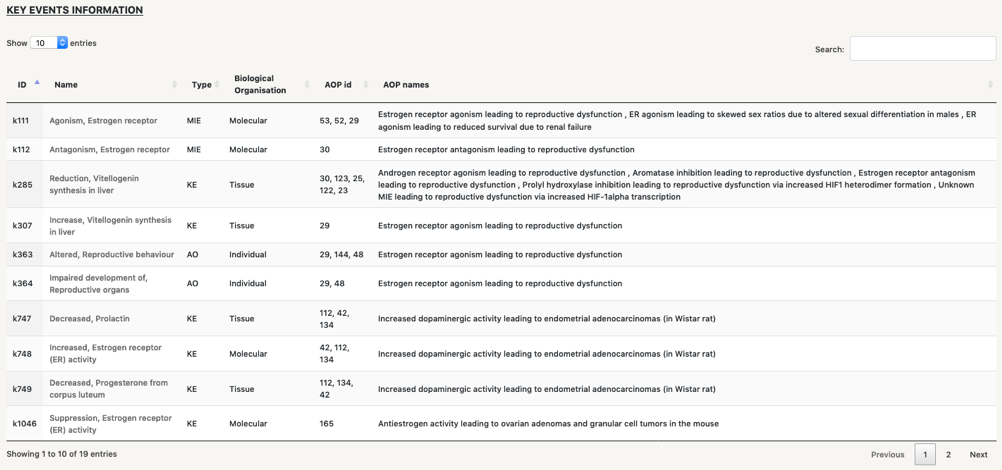
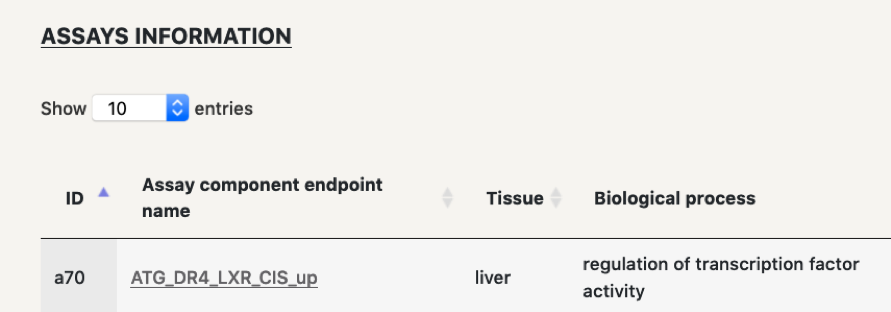
Table information:
Below the network we find four tables that contain information of the different types of nodes in the network:
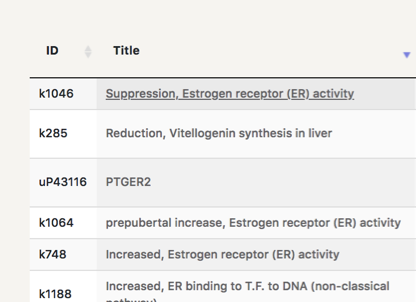
Fast search:by clicking on the name of any of the nodes in the tables, you will be re-directed to the specific seacrh page for this node, so you can start a new seach where the central node will be the one you have selected. For instance, by clicking on “Supression, Estrogen receptor (ER) activity”, a new search page for it will open up.
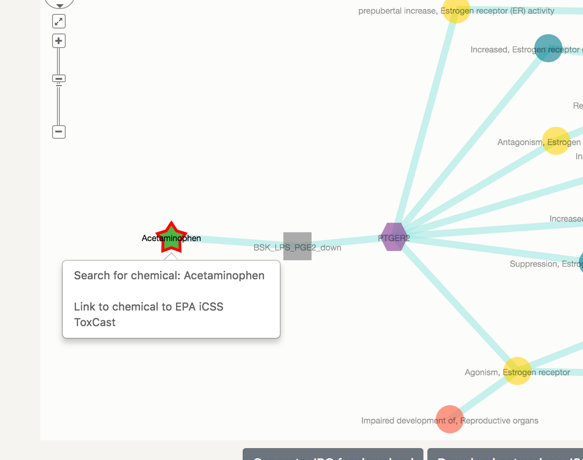
Clicking on the node: when clicking on any node a pop-up window will appear with links to specific public domains that contain more informatoin on the selected node.
On the first link, it will redirect you to the search page of the selected node and the second link will redirect you to the publicly available webpage, where the chemical, assay, key event or AOP are listed, with all their details.
High number of nodes:
For some searches, the number of chemicals associated might be too high to visualise correctly. Here we show an example of what could be done to better understand the results of your searches.
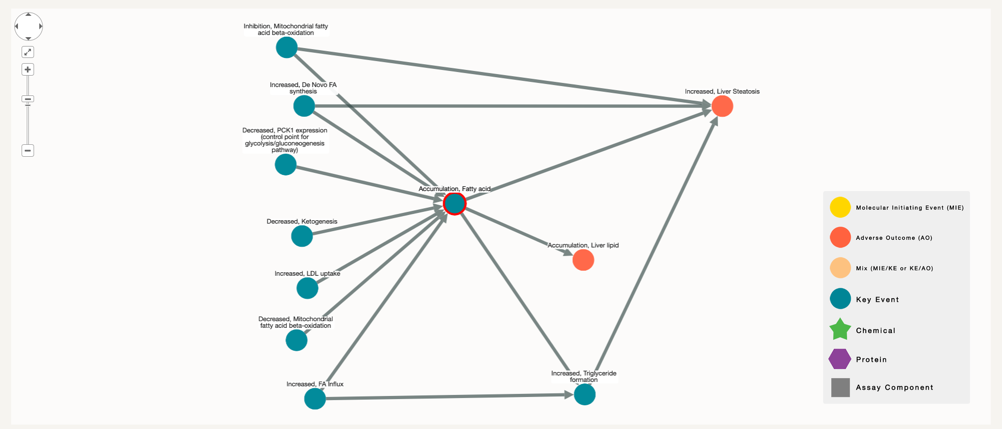
On this example we search for “Accumulation, Fatty acid” in Key Event with degree 1, here only key events appear connected to each other.
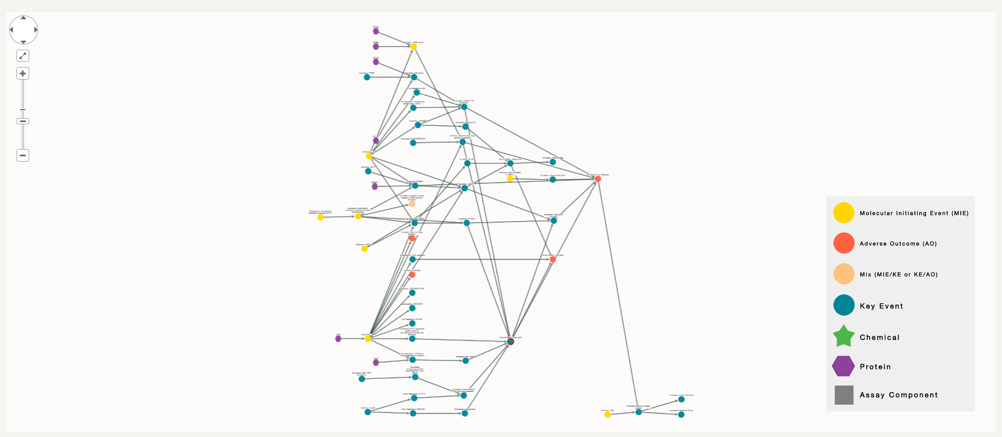
If we increase the number of nodes to see which other key events or proteins are co-related to it, the number of nodes will increase slowly (selection of degree 3)
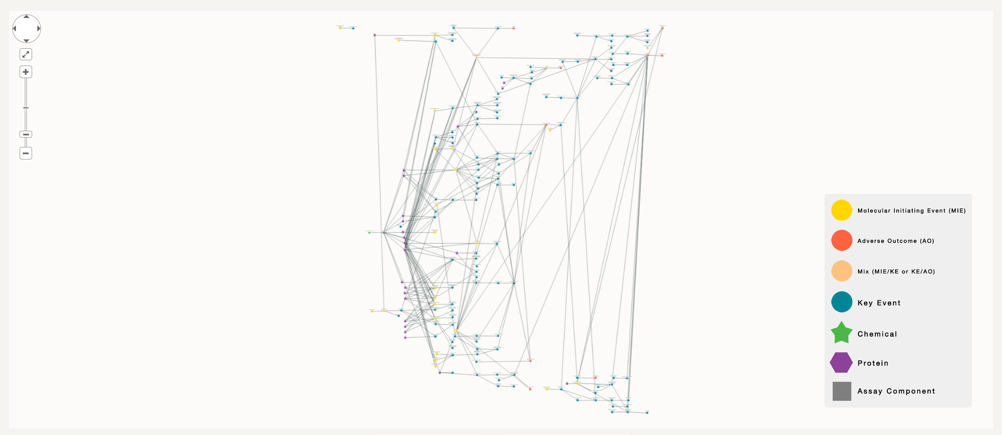
However, if our goal is to figure which chemicals could be correlated to part of this AOP, or to this specific key event, we have to increase the number of degree of separation to 5, where the number of nodes is too high to be visually comprehensible.
In this case there are two options. Download the nodes and edges files in order to run your analysis further. Or on the other hand, select which assay you might have an interest on, click on it and make a more focused search with this node, so that the number of chemicals in the final visualisation is reduced.
With this new search you can then see which proteins and chemicals are associated with this assay, so that you can connect this chemical to the key event of interest.
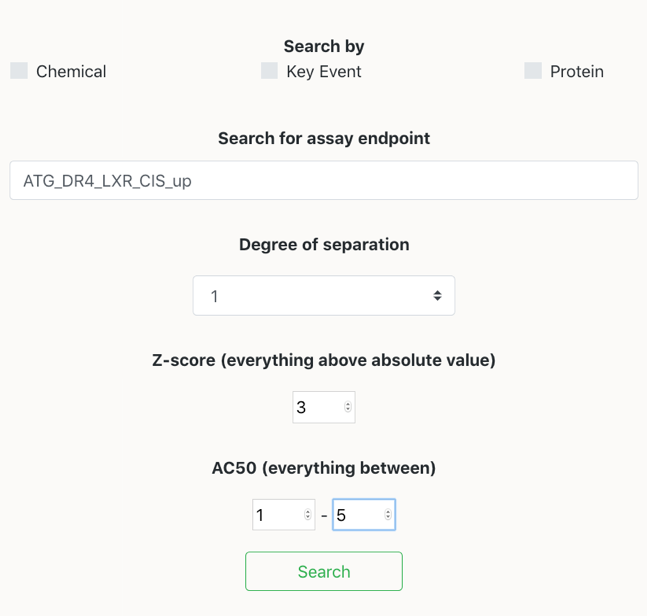
Filtering by AC50 and z-score: In cases where the number of chemicals and assays are too high, the user can make a reduction by filtering by the AC50 and/or z-score. Hence, the network will only output those connections where the value of z-score was above or equal to the absolute value of the selected value.

Selecting the same assay and filtering by, the connections between assay and chemicals having an AC50 (in micromolar) between 1 and 5 uM, and an absolute value of z-score above or equal to 3, a lesser amount of chemicals appear in the network.
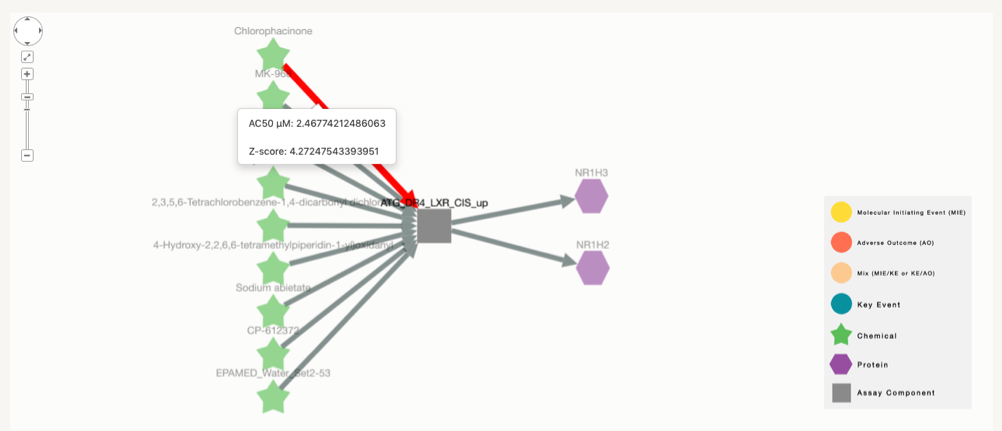
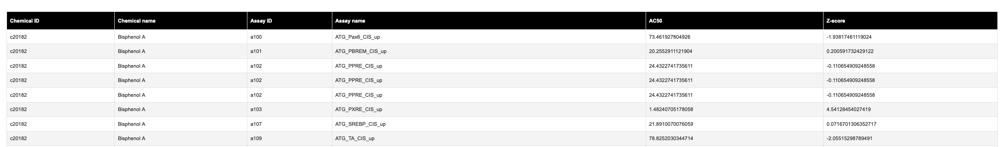
Activity and cytotoxicity score between chemical and assays:for each connection between chemical and assay there exists and AC50 and z-score associated value. When clicking on the edge between each chemical-assay combination a pop-up window appears with the mentioned information
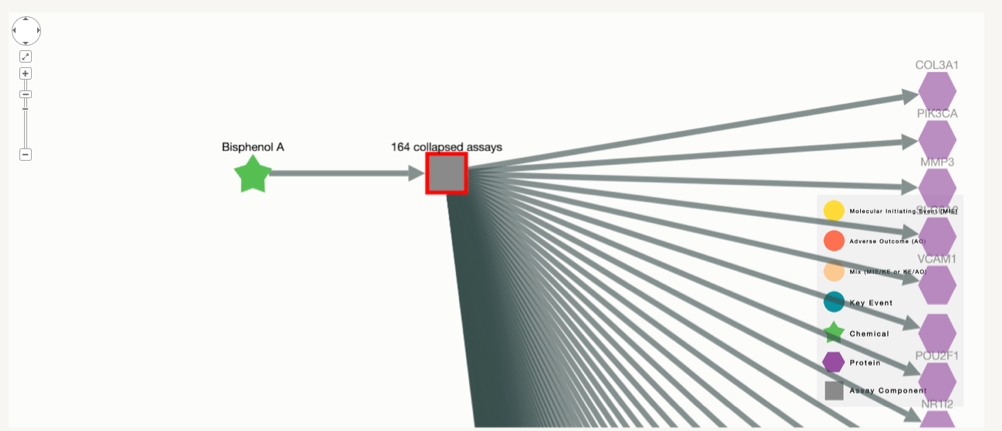
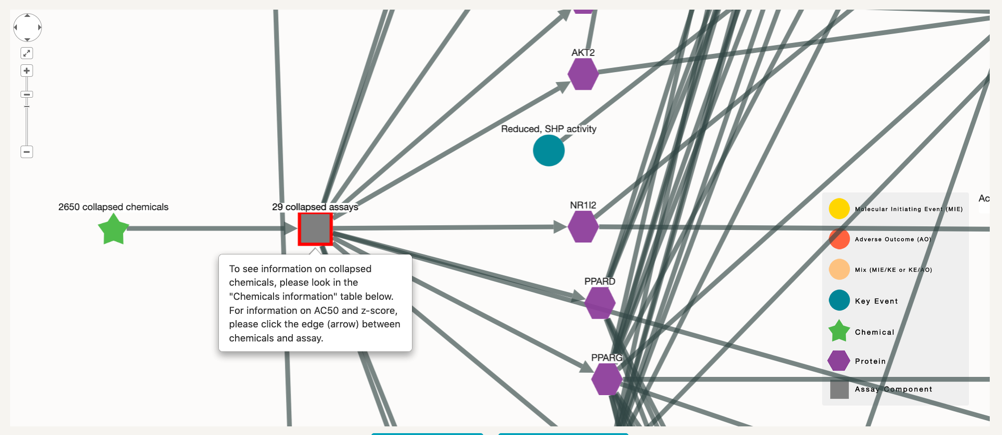
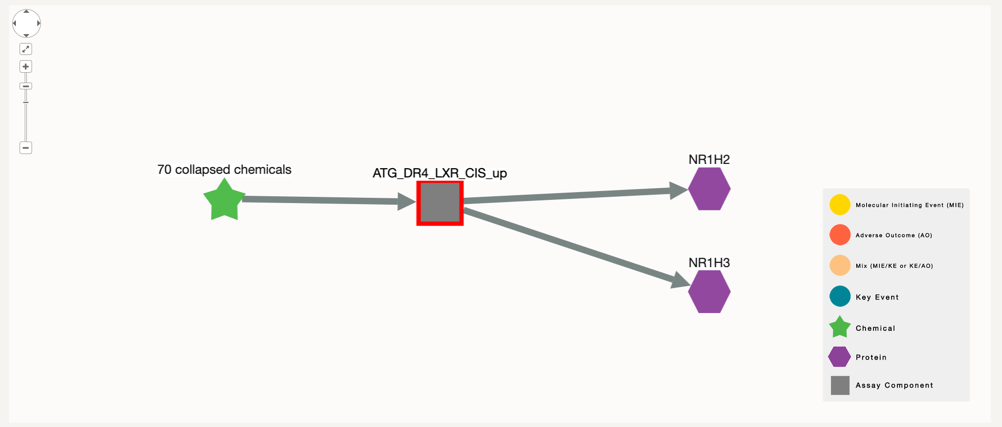
Networks with many chemicals or assays:In some cases, the number of chemicals or assays associated with the network are more than 20, which makes it difficult for the network to be comprehensible. For simplification reasons, when the number of chemicals, assays or both is above 20, these will be collapsed into one single node. Regardless of the network, the information for all the nodes will still appear on the tables.
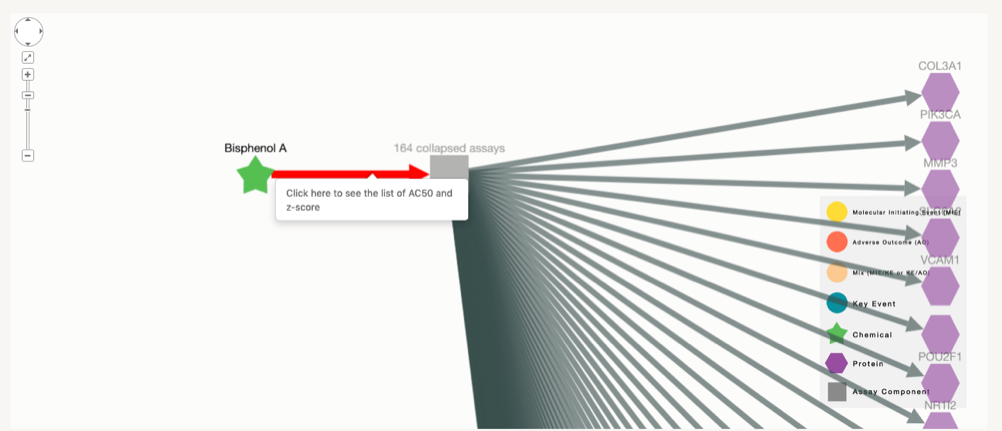
In these cases, when clicking on the edge, the AC50 and z-score will no directly appear, but the user will have to click on the link to open the table that contains that information.

AC50 (concentration where half maximal activity occurs): Biological activity, which can be expressed as potency of compounds, is an important parameter in drug discovery and screening. Standard potency estimates are expressed as IC50, EC50 or simply as AC50 values, which derive from the concentration-response curves. These are calculated from assays designed to measure activation, inhibition or modulation of targets and pathways of pharmacological significance
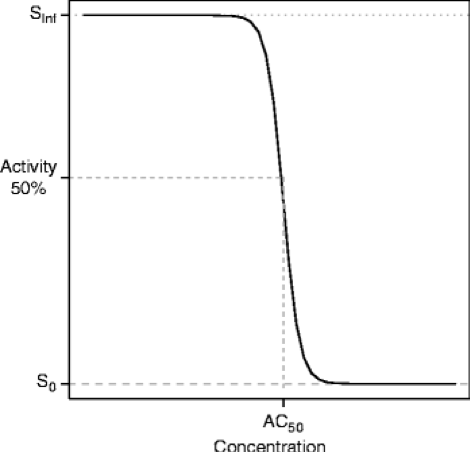
The AC50 can then be calculated based on the Hill equation:
% of control activity = 100 + MAX*[A]^n/(AC50 + [A]^n)
where [A] is the activator concentration, MAX is the maximal % of activation, and n is the Hill coefficient
Z-score to calculate cytotoxicity: Cytotoxicity can be a confounding factor in the evaluation of specific in vitro assay effects. In ToxCast they defined a concentration at which chemicals exerted cytotoxicity. The median AC50 from 35 ToxCast assays, which measured specifically cytotoxicty was used to define a "cytotoxicity center" for each chemical. In order to calculate a cytotoxicity center, chemicals must have elicited a significant effect in at least three cytotoxicity assays. To filter out bioactivity that may have been confounded by cytotoxicity, in ToxCast they defined a "cytotoxicity limit" by mulitplying the global median absolute deviation (MAD) of all chemicals across all assay endpoints by 3.
In ToxCast a Z-score value was assigned to each combinaiton of chemical-assay hit. For chemicals with 2 or more hits in cytotoxic assays, the median logAC50(cytotox) and the MAD of the logAC50(cytotox) was calculated. Then the median of the MAD of the logAC50(cytotox) across all chemicals was calculated to define the global cytotoxicity MAD. This is how the Z-score was calculated
Z(chemical, assay) = -logAC50(chemical, assay)-median[-logAC50(chemical, cytotox)]/global cytotoxicity MAD